

Python is one tool that has been nothing short of a revolution for marketing analysts. And I am sure you’ll agree with this statement by the end of this article.
Why Use a Separate Tool? Isn’t Facebook Ads Manager Dashboard enough?
The objective here is to derive actionable insights from Facebook campaigns data. The data view provided by the Facebook Ads Manager dashboard is a top-level view, which is just sufficient for reporting. But in order to get insights, we need to do thorough research at a granular level. We need to decipher correlations between metrics. Using Python, we will be able to analyze the effects of Ad Copies / Ad Content, Targeting, Quality Ranking, Budget etc. on performance metrics like Clicks and Conversions. And this has been the motivation behind writing this article.
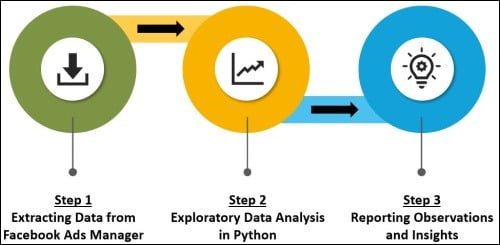
The flow of the process shall be:
1. Extracting Data from Facebook Ads Manager
2. Exploratory Data Analysis in Python
3. Reporting Observations and Insights
This article contains Step-1.
Steps 2 & 3 have been covered in Data Analysis using Python – Part II.
Step-1: Extract Data from Facebook Ads Manager
Facebook has drastically improved its reporting by introducing a new structure. Now you can get data on various breakdowns like day, campaign ID, Ad Set ID, Ads ID along with the previous breakdowns of Age, Gender, Device, Time of Day etc.
We will utilize this facility to export data on the minutest of breakdowns.
1. Visit the Facebook Ads Manager dashboard.
2. Click Reports > Create custom report
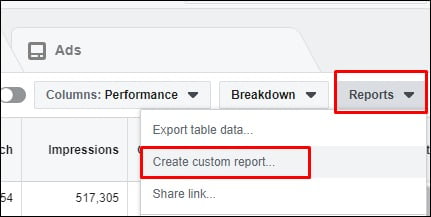
This is only a one time process. Once the report layout is created, you are sorted till eternity!
3. In the left sidebar, you’ll find two options: Breakdown and Metrics.
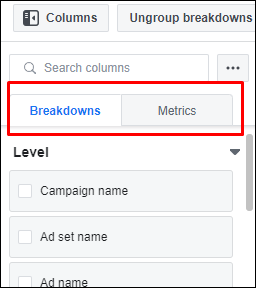
A first look at these can be overwhelming, but don’t worry.
4. In the breakdown section select the following:
Level: Campaign Name, Ad set Name, Ad Name
Time: Day
Delivery: Age, Gender
Keep rest of the options unchecked.
Note: We are doing a demographic analysis in this article hence Age and Gender is selected. Alternatively, you can select other delivery metrics as the need arises.
5. In the Metrics section select the following:
Performance: Results, Reach, Frequency, Impressions, Amount Spent, Clicks (all)
Settings: Objective, Body (ad settings)
Note: Based on the case, different metrics can be selected here as well.
6. Arrange the columns in the following order:
Day, Campaign Name, Ad Set Name, Ad Name, Age, Gender, Impressions, Reach, Clicks, Results, Amount Spent, Frequency, Objective, Body
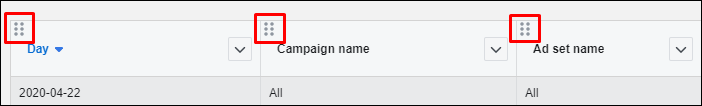
You can re-arrange the columns using the dotted button on top of each column.
7. Click on Save on the top right side to save the reporting layout for future use. Give it a suitable name.

8. Update the duration for which you want to fetch the data by selecting the start and end dates.
Since, we are exporting data on various breakdowns, it will take some time for Facebook to retrieve all data. Initially, I recommend going easy on Facebook and start with data ranging from a few days to 10 days window.
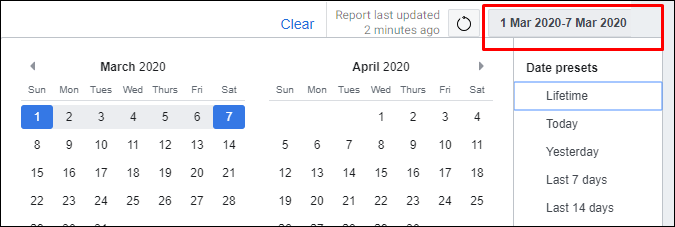
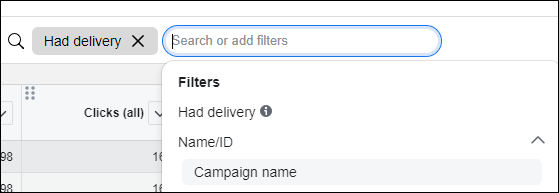
9. Also, it is recommended to add a filter for the campaign name that you want to analyse.
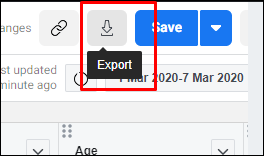
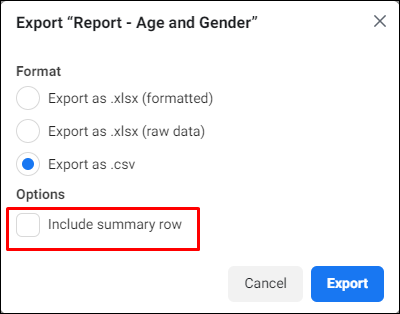
10. To export the data, click export button and select as .csv option
Make sure to uncheck the ‘Include Summary Row’ option
Congratulations! The first step of exporting the data is complete. In the next article, we’ll learn the steps to import this data and do a thorough analysis in python.